General
✓✗Directions: Study the following table carefully and answer the question given below.
Speed of five trains and the time each takes to cross a pole
If the speed of train A is increased by 50%, how much time (in seconds) will it take to cross a pole?
Speed of five trains and the time each takes to cross a pole
| Train | Speed (in km/h) | Time taken to cross a pole (in seconds) |
| A | 72 | 12 |
| B | 72 | 16 |
| C | 54 | 20 |
| D | 36 | 18 |
| E | 54 | 19 |
If the speed of train A is increased by 50%, how much time (in seconds) will it take to cross a pole?
- 6
- 8
- 9
- 10
- 11
General
✓✗Directions: Study the following table carefully and answer the question given below.
Speed of five trains and the time each takes to cross a pole
What is the ratio of the length of train D to the length of train A?
Speed of five trains and the time each takes to cross a pole
| Train | Speed (in km/h) | Time taken to cross a pole (in seconds) |
| A | 72 | 12 |
| B | 72 | 16 |
| C | 54 | 20 |
| D | 36 | 18 |
| E | 54 | 19 |
What is the ratio of the length of train D to the length of train A?
- 4 : 3
- 1 : 2
- 2 : 3
- 3 : 4
- 4 : 5
General
✓✗Directions: Study the following table carefully and answer the question given below.
Speed of five trains and the time each takes to cross a pole
Trains E and A run towards each other on parallel tracks. How much time (in seconds) will they take to cross each other?
Speed of five trains and the time each takes to cross a pole
| Train | Speed (in km/h) | Time taken to cross a pole (in seconds) |
| A | 72 | 12 |
| B | 72 | 16 |
| C | 54 | 20 |
| D | 36 | 18 |
| E | 54 | 19 |
Trains E and A run towards each other on parallel tracks. How much time (in seconds) will they take to cross each other?
- 5
- 10
- 15
- 20
- 25
General
✓✗Directions: Study the following table carefully and answer the question given below.
Speed of five trains and the time each takes to cross a pole
What is the length (in metres) of train B?
Speed of five trains and the time each takes to cross a pole
| Train | Speed (in km/h) | Time taken to cross a pole (in seconds) |
| A | 72 | 12 |
| B | 72 | 16 |
| C | 54 | 20 |
| D | 36 | 18 |
| E | 54 | 19 |
What is the length (in metres) of train B?
- 115
- 300
- 310
- 320
- 330
General
✓✗Directions: Study the following table carefully and answer the question given below.
Speed of five trains and the time each takes to cross a pole
Train B overtakes train C running in the same direction. How much time (in seconds) does it take to pass train C completely?
Speed of five trains and the time each takes to cross a pole
| Train | Speed (in km/h) | Time taken to cross a pole (in seconds) |
| A | 72 | 12 |
| B | 72 | 16 |
| C | 54 | 20 |
| D | 36 | 18 |
| E | 54 | 19 |
Train B overtakes train C running in the same direction. How much time (in seconds) does it take to pass train C completely?
- 114
- 119
- 124
- 129
- 134
General
✓✗Directions: Study the following bar graph carefully and answer the question given below.
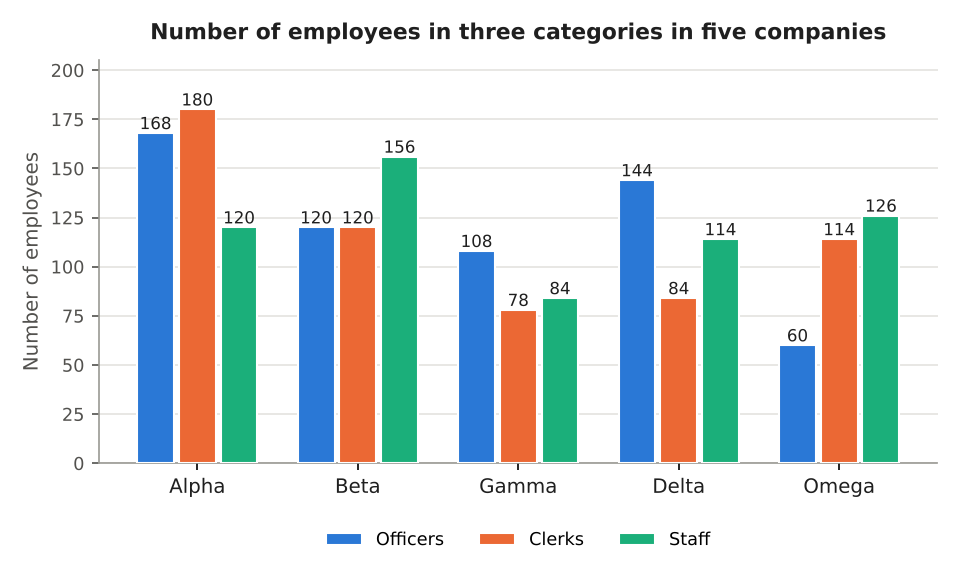
What is the difference between the average number of clerks and the average number of officers per company?
What is the difference between the average number of clerks and the average number of officers per company?
- 0.8
- 1.8
- 2.8
- 3.8
- 4.8
General
✓✗Directions: Study the following bar graph carefully and answer the question given below.
What is the ratio of the number of support staff in Gamma and Delta together to the number of officers in Beta and Omega together?
What is the ratio of the number of support staff in Gamma and Delta together to the number of officers in Beta and Omega together?
- 11 : 10
- 13 : 10
- 10 : 11
- 11 : 12
- 1 : 1
General
✓✗Directions: Study the following bar graph carefully and answer the question given below.
In how many companies is the total number of employees more than 380?
In how many companies is the total number of employees more than 380?
- 0
- 1
- 2
- 3
- 4
General
✓✗Directions: Read the following information carefully and answer the question given below.
8400 candidates appeared in an examination from three schools X, Y and Z in the ratio 3 : 5 : 2 respectively. The pass percentages of X, Y and Z were 40%, 65% and 70% respectively. Among the candidates who passed from school X, the ratio of boys to girls was 7 : 5. The number of girls who passed from school Y was 150% of the number of girls who passed from school X.
How many boys passed from school Y?
- 2000
- 2050
- 2100
- 2150
- 2200
General
✓✗Directions: Read the following information carefully and answer the question given below.
8400 candidates appeared in an examination from three schools X, Y and Z in the ratio 3 : 5 : 2 respectively. The pass percentages of X, Y and Z were 40%, 65% and 70% respectively. Among the candidates who passed from school X, the ratio of boys to girls was 7 : 5. The number of girls who passed from school Y was 150% of the number of girls who passed from school X.
What is the overall pass percentage of the three schools taken together?
- 58.5%
- 59.5%
- 60.5%
- 61.5%
- 62.5%
General
✓✗Directions: Read the following information carefully and answer the question given below.
8400 candidates appeared in an examination from three schools X, Y and Z in the ratio 3 : 5 : 2 respectively. The pass percentages of X, Y and Z were 40%, 65% and 70% respectively. Among the candidates who passed from school X, the ratio of boys to girls was 7 : 5. The number of girls who passed from school Y was 150% of the number of girls who passed from school X.
What is the ratio of the number of candidates who passed from school Z to the number who passed from school X?
- 7 : 6
- 8 : 5
- 7 : 8
- 6 : 7
- 8 : 7
General
✓✗Directions: Read the following information carefully and answer the question given below.
8400 candidates appeared in an examination from three schools X, Y and Z in the ratio 3 : 5 : 2 respectively. The pass percentages of X, Y and Z were 40%, 65% and 70% respectively. Among the candidates who passed from school X, the ratio of boys to girls was 7 : 5. The number of girls who passed from school Y was 150% of the number of girls who passed from school X.
What is the total number of candidates who failed from all the three schools together?
- 3086
- 3186
- 3286
- 3386
- 3486
General
✓✗Directions: Study the following graph and table carefully and answer the question given below.
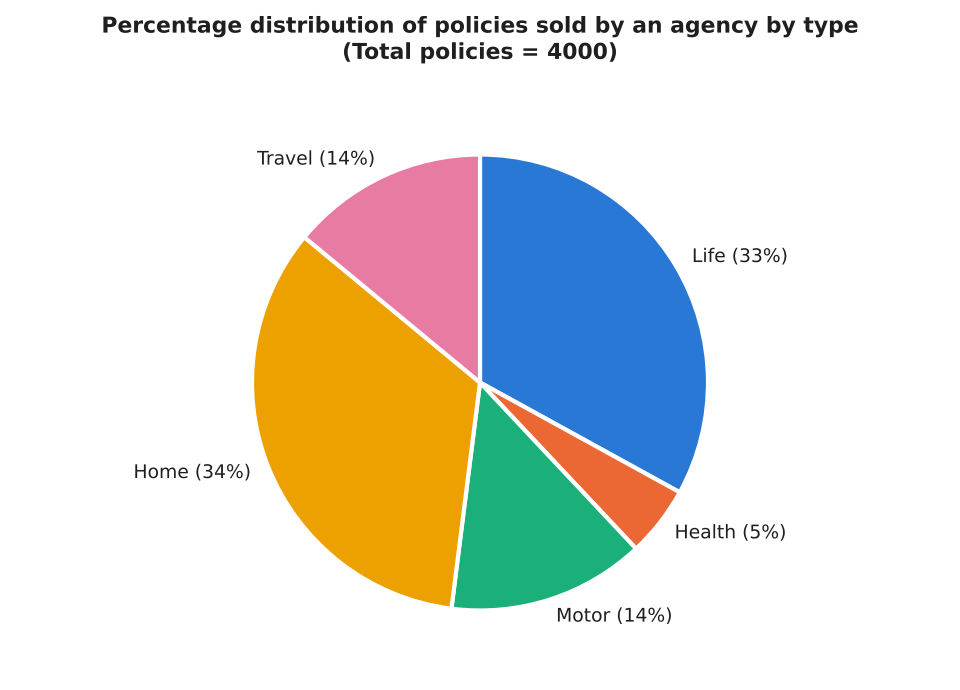
Ratio of new policies to renewed policies, and percentage of renewed policies that were sold through agents, in each policy type
What is the ratio of the number of new policies in the Motor category to the number of renewed policies that were sold through agents in the Home category?
Ratio of new policies to renewed policies, and percentage of renewed policies that were sold through agents, in each policy type
| Policy type | New : Renewed | Renewed policies that were sold through agents (%) |
| Life | 1 : 1 | 80 |
| Health | 3 : 5 | 20 |
| Motor | 5 : 3 | 50 |
| Home | 3 : 7 | 50 |
| Travel | 5 : 3 | 80 |
What is the ratio of the number of new policies in the Motor category to the number of renewed policies that were sold through agents in the Home category?
- 25 : 33
- 34 : 25
- 27 : 35
- 12 : 17
- 25 : 34
General
✓✗Directions: Study the following graph and table carefully and answer the question given below.
Ratio of new policies to renewed policies, and percentage of renewed policies that were sold through agents, in each policy type
What is the number of renewed policies that were not sold through agents in the Home category?
Ratio of new policies to renewed policies, and percentage of renewed policies that were sold through agents, in each policy type
| Policy type | New : Renewed | Renewed policies that were sold through agents (%) |
| Life | 1 : 1 | 80 |
| Health | 3 : 5 | 20 |
| Motor | 5 : 3 | 50 |
| Home | 3 : 7 | 50 |
| Travel | 5 : 3 | 80 |
What is the number of renewed policies that were not sold through agents in the Home category?
- 476
- 486
- 496
- 506
- 516
General
✓✗Directions: Study the following graph and table carefully and answer the question given below.
Ratio of new policies to renewed policies, and percentage of renewed policies that were sold through agents, in each policy type
The number of renewed policies that were sold through agents in the Life category is what percent of the total number of policies in the Life category?
Ratio of new policies to renewed policies, and percentage of renewed policies that were sold through agents, in each policy type
| Policy type | New : Renewed | Renewed policies that were sold through agents (%) |
| Life | 1 : 1 | 80 |
| Health | 3 : 5 | 20 |
| Motor | 5 : 3 | 50 |
| Home | 3 : 7 | 50 |
| Travel | 5 : 3 | 80 |
The number of renewed policies that were sold through agents in the Life category is what percent of the total number of policies in the Life category?
- 10%
- 20%
- 30%
- 40%
- 80%
General
✓✗Directions: Study the following graph and table carefully and answer the question given below.
Ratio of new policies to renewed policies, and percentage of renewed policies that were sold through agents, in each policy type
What is the number of renewed policies that were sold through agents in the Home category?
Ratio of new policies to renewed policies, and percentage of renewed policies that were sold through agents, in each policy type
| Policy type | New : Renewed | Renewed policies that were sold through agents (%) |
| Life | 1 : 1 | 80 |
| Health | 3 : 5 | 20 |
| Motor | 5 : 3 | 50 |
| Home | 3 : 7 | 50 |
| Travel | 5 : 3 | 80 |
What is the number of renewed policies that were sold through agents in the Home category?
- 446
- 456
- 466
- 476
- 486
General
✓✗Directions: Study the following graph and table carefully and answer the question given below.
Ratio of new policies to renewed policies, and percentage of renewed policies that were sold through agents, in each policy type
What is the average number of new policies in the policy types Life, Health and Home?
Ratio of new policies to renewed policies, and percentage of renewed policies that were sold through agents, in each policy type
| Policy type | New : Renewed | Renewed policies that were sold through agents (%) |
| Life | 1 : 1 | 80 |
| Health | 3 : 5 | 20 |
| Motor | 5 : 3 | 50 |
| Home | 3 : 7 | 50 |
| Travel | 5 : 3 | 80 |
What is the average number of new policies in the policy types Life, Health and Home?
- 341
- 351
- 361
- 371
- 381
General
✓✗Directions: Study the following table carefully and answer the question given below.
Total number of students in five colleges and the percentage distribution of these students among four streams
Next year, the total students in college P increased by 15% and the share of Commerce became 50%. By how much did the number of Commerce students in college P increase?
Total number of students in five colleges and the percentage distribution of these students among four streams
| College | Total students | Arts (%) | Science (%) | Commerce (%) | Management (%) |
| P | 1520 | 30 | 10 | 45 | 15 |
| Q | 960 | 30 | 40 | 20 | 10 |
| R | 1200 | 15 | 15 | 45 | 25 |
| S | 840 | 30 | 25 | 15 | 30 |
| T | 1720 | 10 | 35 | 45 | 10 |
Next year, the total students in college P increased by 15% and the share of Commerce became 50%. By how much did the number of Commerce students in college P increase?
- 76
- 175
- 180
- 185
- 190
General
✓✗Directions: Study the following table carefully and answer the question given below.
Total number of students in five colleges and the percentage distribution of these students among four streams
The number of Arts students in college P is what percent more than the number of Commerce students in college Q?
Total number of students in five colleges and the percentage distribution of these students among four streams
| College | Total students | Arts (%) | Science (%) | Commerce (%) | Management (%) |
| P | 1520 | 30 | 10 | 45 | 15 |
| Q | 960 | 30 | 40 | 20 | 10 |
| R | 1200 | 15 | 15 | 45 | 25 |
| S | 840 | 30 | 25 | 15 | 30 |
| T | 1720 | 10 | 35 | 45 | 10 |
The number of Arts students in college P is what percent more than the number of Commerce students in college Q?
- 127.5%
- 132.5%
- 137.5%
- 142.5%
- 147.5%
General
✓✗Directions: Study the following table carefully and answer the question given below.
Total number of students in five colleges and the percentage distribution of these students among four streams
What is the difference between the total number of Arts students in all the five colleges together and the total number of Commerce students in all the five colleges together?
Total number of students in five colleges and the percentage distribution of these students among four streams
| College | Total students | Arts (%) | Science (%) | Commerce (%) | Management (%) |
| P | 1520 | 30 | 10 | 45 | 15 |
| Q | 960 | 30 | 40 | 20 | 10 |
| R | 1200 | 15 | 15 | 45 | 25 |
| S | 840 | 30 | 25 | 15 | 30 |
| T | 1720 | 10 | 35 | 45 | 10 |
What is the difference between the total number of Arts students in all the five colleges together and the total number of Commerce students in all the five colleges together?
- 868
- 893
- 918
- 943
- 968
General
✓✗Directions: Study the following pie charts carefully and answer the question given below.
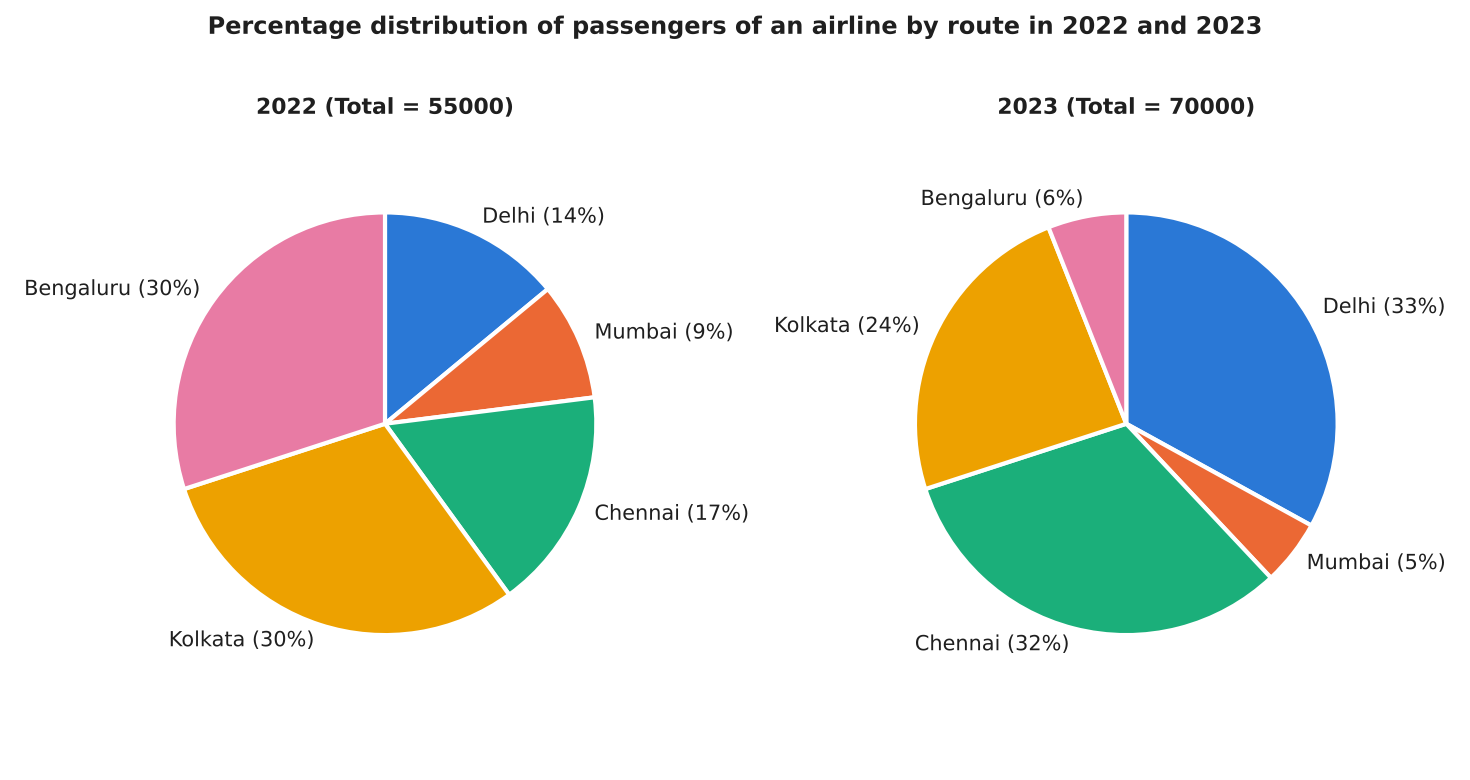
What is the total number of passengers on the Bengaluru route in 2022 and 2023 together?
What is the total number of passengers on the Bengaluru route in 2022 and 2023 together?
- 18700
- 19200
- 19700
- 20200
- 20700
General
✓✗Directions: Study the following pie charts carefully and answer the question given below.
What is the average of the number of passengers on the Delhi, Kolkata and Bengaluru routes in 2023?
What is the average of the number of passengers on the Delhi, Kolkata and Bengaluru routes in 2023?
- 14450
- 14700
- 14950
- 15200
- 15450
General
✓✗Directions: Study the following pie charts carefully and answer the question given below.
What is the percentage increase in the number of passengers on the Delhi route from 2022 to 2023?
What is the percentage increase in the number of passengers on the Delhi route from 2022 to 2023?
- 180%
- 190%
- 200%
- 210%
- 220%
General
✓✗Directions: Study the following table carefully, in which some values are missing (shown as ?), and answer the question given below.
Cost price, marked price, discount, selling price and profit percentage of five watches
What is the profit percentage on Watch D?
Cost price, marked price, discount, selling price and profit percentage of five watches
| Watch | Cost price (Rs.) | Marked price (Rs.) | Discount (%) | Selling price (Rs.) | Profit (%) |
| Watch A | 240 | 320 | ? | ? | 20 |
| Watch B | 1600 | 2240 | ? | ? | 12 |
| Watch C | 1240 | ? | 20 | ? | 20 |
| Watch D | 1800 | 3150 | ? | 2520 | ? |
| Watch E | 440 | 770 | 20 | ? | ? |
What is the profit percentage on Watch D?
- 10%
- 20%
- 30%
- 40%
- 50%
General
✓✗Directions: Study the following table carefully, in which some values are missing (shown as ?), and answer the question given below.
Cost price, marked price, discount, selling price and profit percentage of five watches
What is the marked price (in Rs.) of Watch C?
Cost price, marked price, discount, selling price and profit percentage of five watches
| Watch | Cost price (Rs.) | Marked price (Rs.) | Discount (%) | Selling price (Rs.) | Profit (%) |
| Watch A | 240 | 320 | ? | ? | 20 |
| Watch B | 1600 | 2240 | ? | ? | 12 |
| Watch C | 1240 | ? | 20 | ? | 20 |
| Watch D | 1800 | 3150 | ? | 2520 | ? |
| Watch E | 440 | 770 | 20 | ? | ? |
What is the marked price (in Rs.) of Watch C?
- 1760
- 1810
- 1860
- 1910
- 1960
General
✓✗Directions: Study the following table carefully, in which some values are missing (shown as ?), and answer the question given below.
Cost price, marked price, discount, selling price and profit percentage of five watches
What is the total profit (in Rs.) on selling 8 units of Watch B?
Cost price, marked price, discount, selling price and profit percentage of five watches
| Watch | Cost price (Rs.) | Marked price (Rs.) | Discount (%) | Selling price (Rs.) | Profit (%) |
| Watch A | 240 | 320 | ? | ? | 20 |
| Watch B | 1600 | 2240 | ? | ? | 12 |
| Watch C | 1240 | ? | 20 | ? | 20 |
| Watch D | 1800 | 3150 | ? | 2520 | ? |
| Watch E | 440 | 770 | 20 | ? | ? |
What is the total profit (in Rs.) on selling 8 units of Watch B?
- 1536
- 1586
- 1636
- 1686
- 1736
General
✓✗Directions: Study the following table carefully, in which some values are missing (shown as ?), and answer the question given below.
Cost price, marked price, discount, selling price and profit percentage of five watches
What is the discount percentage on Watch D?
Cost price, marked price, discount, selling price and profit percentage of five watches
| Watch | Cost price (Rs.) | Marked price (Rs.) | Discount (%) | Selling price (Rs.) | Profit (%) |
| Watch A | 240 | 320 | ? | ? | 20 |
| Watch B | 1600 | 2240 | ? | ? | 12 |
| Watch C | 1240 | ? | 20 | ? | 20 |
| Watch D | 1800 | 3150 | ? | 2520 | ? |
| Watch E | 440 | 770 | 20 | ? | ? |
What is the discount percentage on Watch D?
- 10%
- 20%
- 30%
- 40%
- 50%
General
✓✗Directions: Study the following line graph carefully and answer the question given below.
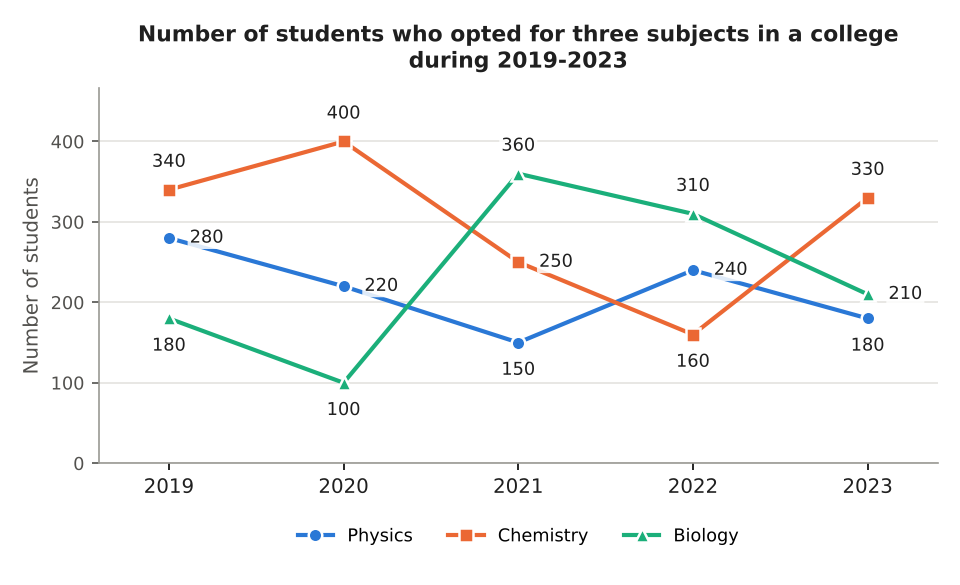
If the number of students who opted for Physics in 2019 had been 15% more and the number of students who opted for Chemistry in 2019 had been 10% less, what would have been the sum of these two in 2019?
If the number of students who opted for Physics in 2019 had been 15% more and the number of students who opted for Chemistry in 2019 had been 10% less, what would have been the sum of these two in 2019?
- 628
- 651
- 653
- 678
- 703
General
✓✗Directions: Study the following line graph carefully and answer the question given below.
By what percent should the number of students who opted for Chemistry in 2022 be increased so that it becomes equal to the number of students who opted for Chemistry in 2021?
By what percent should the number of students who opted for Chemistry in 2022 be increased so that it becomes equal to the number of students who opted for Chemistry in 2021?
- 36%
- 56.25%
- 57.25%
- 58.25%
- 59.25%
General
✓✗Directions: Study the following line graph carefully and answer the question given below.
In how many years is the total number of students who opted for the three subjects more than 750?
In how many years is the total number of students who opted for the three subjects more than 750?
- 1
- 2
- 3
- 4
- 5