General
✓✗Directions: Study the following line graph carefully and answer the question given below.
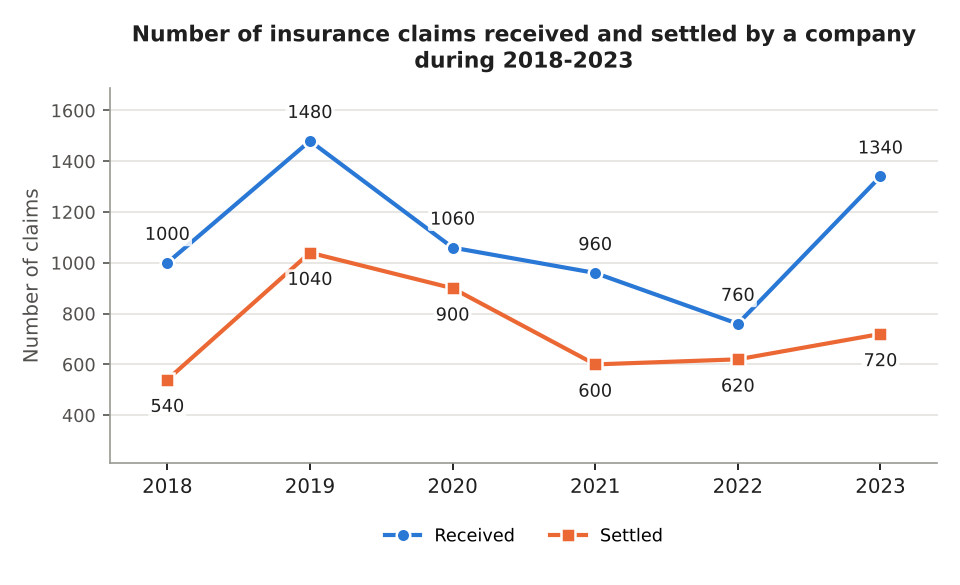
What is the percentage increase in the number of claims not settled (received - settled) from 2020 to 2021?
What is the percentage increase in the number of claims not settled (received - settled) from 2020 to 2021?
- 125%
- 130%
- 135%
- 140%
- 145%
General
✓✗Directions: Study the following line graph carefully and answer the question given below.
The number of claims not settled (received - settled) in 2021 is what percent of the number of claims settled in 2021?
The number of claims not settled (received - settled) in 2021 is what percent of the number of claims settled in 2021?
- 50%
- 60%
- 70%
- 80%
- 90%
General
✓✗Directions: Study the following line graph carefully and answer the question given below.
What is the ratio of the number of claims received in 2018 and 2023 together to the number of claims settled in 2020 and 2021 together?
What is the ratio of the number of claims received in 2018 and 2023 together to the number of claims settled in 2020 and 2021 together?
- 3 : 2
- 14 : 9
- 39 : 25
- 25 : 39
- 19 : 13
General
✓✗Directions: Study the following pie charts carefully and answer the question given below.
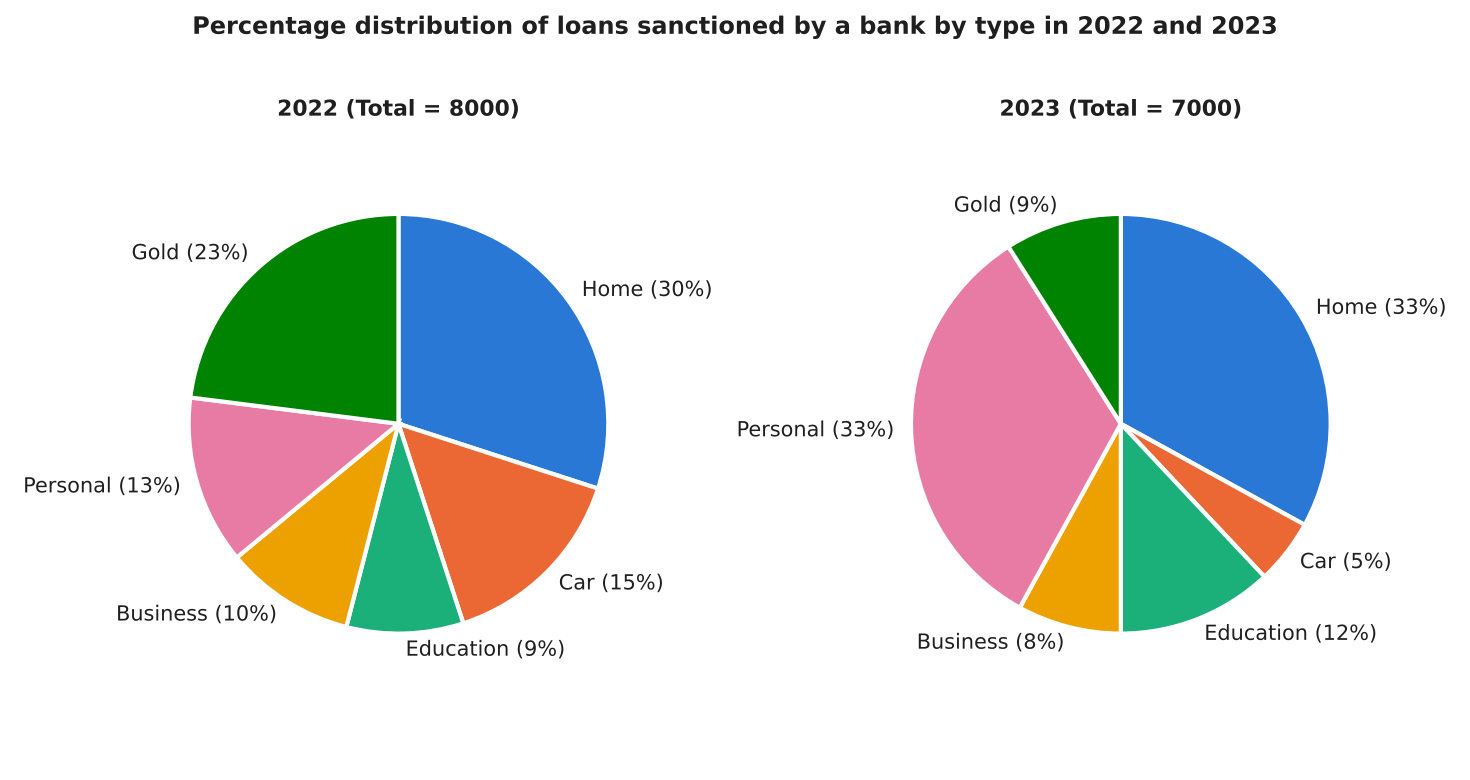
Taking 2022 and 2023 together, what percent of the total number of loans sanctioned belong to Car and Gold?
Taking 2022 and 2023 together, what percent of the total number of loans sanctioned belong to Car and Gold?
- 26%
- 26.8%
- 28.8%
- 30.8%
- 32.8%
General
✓✗Directions: Study the following pie charts carefully and answer the question given below.
In how many types of loan did the number of loans sanctioned increase from 2022 to 2023?
In how many types of loan did the number of loans sanctioned increase from 2022 to 2023?
- 2
- 3
- 4
- 5
- 6
General
✓✗Directions: Study the following pie charts carefully and answer the question given below.
What is the average of the number of Home, Education and Gold loans sanctioned in 2023?
What is the average of the number of Home, Education and Gold loans sanctioned in 2023?
- 1260
- 1280
- 1300
- 1320
- 1340
General
✓✗Directions: Study the following bar graph carefully and answer the question given below.
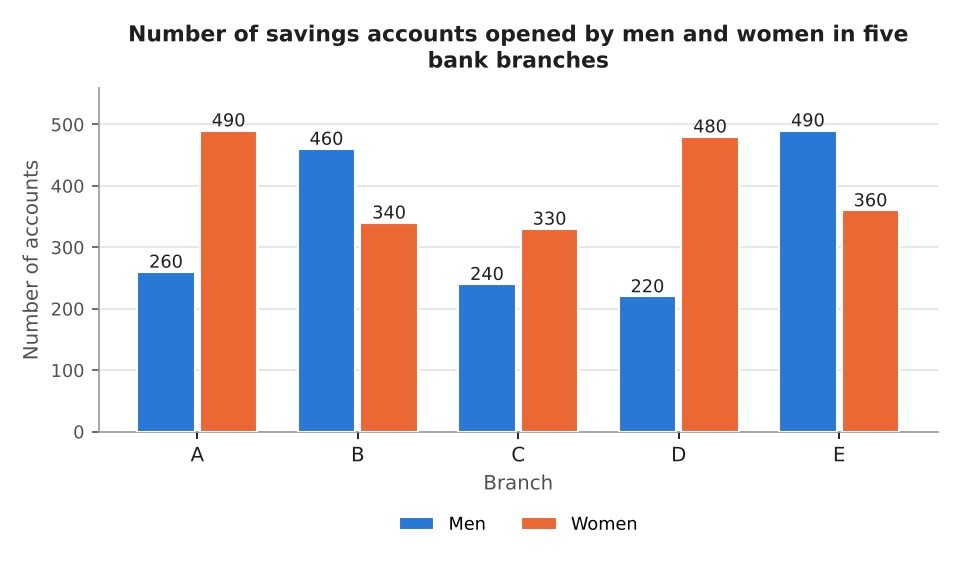
For which branch is the total number of accounts opened the second highest?
For which branch is the total number of accounts opened the second highest?
- Branch A
- Branch B
- Branch C
- Branch D
- Branch E
General
✓✗Directions: Study the following bar graph carefully and answer the question given below.
The number of accounts opened by women in branch B is what percent of the total number of accounts opened in branch B?
The number of accounts opened by women in branch B is what percent of the total number of accounts opened in branch B?
- 38.5%
- 39.5%
- 40.5%
- 41.5%
- 42.5%
General
✓✗Directions: Study the following bar graph carefully and answer the question given below.
What is the difference between the average number of accounts opened by men and the average number of accounts opened by women per branch?
What is the difference between the average number of accounts opened by men and the average number of accounts opened by women per branch?
- 64
- 66
- 68
- 70
- 72
General
✓✗Directions: Read the following information carefully and answer the question given below.
A factory has 2160 workers in three units A, B and C in the ratio 4 : 3 : 2 respectively. In unit A, 40% of the workers are female workers. The number of female workers in unit B is 120 more than the number of female workers in unit A. In unit C, the ratio of male workers to female workers is 7 : 5.
What is the total number of female workers in the factory?
A factory has 2160 workers in three units A, B and C in the ratio 4 : 3 : 2 respectively. In unit A, 40% of the workers are female workers. The number of female workers in unit B is 120 more than the number of female workers in unit A. In unit C, the ratio of male workers to female workers is 7 : 5.
What is the total number of female workers in the factory?
- 1072
- 1088
- 1113
- 1138
- 1163
General
✓✗Directions: Read the following information carefully and answer the question given below.
A factory has 2160 workers in three units A, B and C in the ratio 4 : 3 : 2 respectively. In unit A, 40% of the workers are female workers. The number of female workers in unit B is 120 more than the number of female workers in unit A. In unit C, the ratio of male workers to female workers is 7 : 5.
How many male workers are there in unit B?
A factory has 2160 workers in three units A, B and C in the ratio 4 : 3 : 2 respectively. In unit A, 40% of the workers are female workers. The number of female workers in unit B is 120 more than the number of female workers in unit A. In unit C, the ratio of male workers to female workers is 7 : 5.
How many male workers are there in unit B?
- 211
- 216
- 221
- 226
- 231
General
✓✗Directions: Read the following information carefully and answer the question given below.
A factory has 2160 workers in three units A, B and C in the ratio 4 : 3 : 2 respectively. In unit A, 40% of the workers are female workers. The number of female workers in unit B is 120 more than the number of female workers in unit A. In unit C, the ratio of male workers to female workers is 7 : 5.
What is the ratio of the number of male workers in unit B to the number of male workers in unit A?
A factory has 2160 workers in three units A, B and C in the ratio 4 : 3 : 2 respectively. In unit A, 40% of the workers are female workers. The number of female workers in unit B is 120 more than the number of female workers in unit A. In unit C, the ratio of male workers to female workers is 7 : 5.
What is the ratio of the number of male workers in unit B to the number of male workers in unit A?
- 3 : 7
- 8 : 3
- 5 : 9
- 4 : 7
- 3 : 8
General
✓✗Directions: Read the following information carefully and answer the question given below.
A factory has 2160 workers in three units A, B and C in the ratio 4 : 3 : 2 respectively. In unit A, 40% of the workers are female workers. The number of female workers in unit B is 120 more than the number of female workers in unit A. In unit C, the ratio of male workers to female workers is 7 : 5.
What is the difference between the number of male workers and the number of female workers in unit B?
A factory has 2160 workers in three units A, B and C in the ratio 4 : 3 : 2 respectively. In unit A, 40% of the workers are female workers. The number of female workers in unit B is 120 more than the number of female workers in unit A. In unit C, the ratio of male workers to female workers is 7 : 5.
What is the difference between the number of male workers and the number of female workers in unit B?
- 288
- 293
- 298
- 303
- 308
General
✓✗Directions: Study the following table carefully and answer the question given below.
Speed of five trains and the time each takes to cross a pole
How much time (in seconds) will train M take to cross a platform 360 m long?
Speed of five trains and the time each takes to cross a pole
| Train | Speed (in km/h) | Time taken to cross a pole (in seconds) |
| J | 54 | 20 |
| K | 54 | 23 |
| L | 144 | 6 |
| M | 90 | 20 |
| N | 36 | 13 |
How much time (in seconds) will train M take to cross a platform 360 m long?
- 33.4
- 34.4
- 35.4
- 36.4
- 37.4
General
✓✗Directions: Study the following table carefully and answer the question given below.
Speed of five trains and the time each takes to cross a pole
Train M overtakes train N running in the same direction. How much time (in seconds) does it take to pass train N completely?
Speed of five trains and the time each takes to cross a pole
| Train | Speed (in km/h) | Time taken to cross a pole (in seconds) |
| J | 54 | 20 |
| K | 54 | 23 |
| L | 144 | 6 |
| M | 90 | 20 |
| N | 36 | 13 |
Train M overtakes train N running in the same direction. How much time (in seconds) does it take to pass train N completely?
- 41
- 42
- 43
- 44
- 45
General
✓✗Directions: Study the following table carefully and answer the question given below.
Speed of five trains and the time each takes to cross a pole
Trains K and J run towards each other on parallel tracks. How much time (in seconds) will they take to cross each other?
Speed of five trains and the time each takes to cross a pole
| Train | Speed (in km/h) | Time taken to cross a pole (in seconds) |
| J | 54 | 20 |
| K | 54 | 23 |
| L | 144 | 6 |
| M | 90 | 20 |
| N | 36 | 13 |
Trains K and J run towards each other on parallel tracks. How much time (in seconds) will they take to cross each other?
- 21.5
- 23.5
- 25.5
- 27.5
- 29.5
General
✓✗Directions: Study the following table carefully and answer the question given below.
Speed of five trains and the time each takes to cross a pole
What is the ratio of the length of train N to the length of train L?
Speed of five trains and the time each takes to cross a pole
| Train | Speed (in km/h) | Time taken to cross a pole (in seconds) |
| J | 54 | 20 |
| K | 54 | 23 |
| L | 144 | 6 |
| M | 90 | 20 |
| N | 36 | 13 |
What is the ratio of the length of train N to the length of train L?
- 7 : 12
- 7 : 13
- 24 : 13
- 3 : 5
- 13 : 24
General
✓✗Directions: Study the following table carefully and answer the question given below.
Speed of five trains and the time each takes to cross a pole
What is the length (in metres) of train J?
Speed of five trains and the time each takes to cross a pole
| Train | Speed (in km/h) | Time taken to cross a pole (in seconds) |
| J | 54 | 20 |
| K | 54 | 23 |
| L | 144 | 6 |
| M | 90 | 20 |
| N | 36 | 13 |
What is the length (in metres) of train J?
- 108
- 270
- 280
- 290
- 300
General
✓✗Directions: Study the following table carefully and answer the question given below.
Number of applicants in the recruitment drives of five banks, the ratio of male to female applicants and the percentage of male and female applicants selected
What percentage of the applicants in bank P were selected?
Number of applicants in the recruitment drives of five banks, the ratio of male to female applicants and the percentage of male and female applicants selected
| Bank | Total applicants | Male : Female | Males selected (%) | Females selected (%) |
| P | 1000 | 7 : 3 | 45 | 55 |
| Q | 880 | 6 : 5 | 50 | 40 |
| R | 960 | 5 : 7 | 75 | 50 |
| S | 880 | 7 : 4 | 90 | 80 |
| T | 960 | 5 : 3 | 45 | 80 |
What percentage of the applicants in bank P were selected?
- 45%
- 46%
- 47%
- 48%
- 50%
General
✓✗Directions: Study the following table carefully and answer the question given below.
Number of applicants in the recruitment drives of five banks, the ratio of male to female applicants and the percentage of male and female applicants selected
The number of male applicants who were selected in bank T is what percent of the number of female applicants who were selected in bank Q?
Number of applicants in the recruitment drives of five banks, the ratio of male to female applicants and the percentage of male and female applicants selected
| Bank | Total applicants | Male : Female | Males selected (%) | Females selected (%) |
| P | 1000 | 7 : 3 | 45 | 55 |
| Q | 880 | 6 : 5 | 50 | 40 |
| R | 960 | 5 : 7 | 75 | 50 |
| S | 880 | 7 : 4 | 90 | 80 |
| T | 960 | 5 : 3 | 45 | 80 |
The number of male applicants who were selected in bank T is what percent of the number of female applicants who were selected in bank Q?
- 163.75%
- 168.75%
- 173.75%
- 178.75%
- 183.75%
General
✓✗Directions: Study the following table carefully and answer the question given below.
Number of applicants in the recruitment drives of five banks, the ratio of male to female applicants and the percentage of male and female applicants selected
What is the average number of female applicants who were selected in banks Q, R and S?
Number of applicants in the recruitment drives of five banks, the ratio of male to female applicants and the percentage of male and female applicants selected
| Bank | Total applicants | Male : Female | Males selected (%) | Females selected (%) |
| P | 1000 | 7 : 3 | 45 | 55 |
| Q | 880 | 6 : 5 | 50 | 40 |
| R | 960 | 5 : 7 | 75 | 50 |
| S | 880 | 7 : 4 | 90 | 80 |
| T | 960 | 5 : 3 | 45 | 80 |
What is the average number of female applicants who were selected in banks Q, R and S?
- 212
- 217
- 222
- 227
- 232
General
✓✗Directions: Study the following table carefully, in which some values are missing (shown as ?), and answer the question given below.
Number of members in five clubs: total, female, male, ratio of female to male and percentage female
What is the number of female members in club Q?
Number of members in five clubs: total, female, male, ratio of female to male and percentage female
| Club | Total | Female | Male | Female : Male | Female (%) |
| P | 980 | ? | ? | ? | 45 |
| Q | ? | ? | 108 | ? | 70 |
| R | 900 | ? | 180 | ? | ? |
| S | ? | ? | 88 | 4 : 1 | ? |
| T | ? | 162 | ? | ? | 30 |
What is the number of female members in club Q?
- 242
- 247
- 252
- 257
- 262
General
✓✗Directions: Study the following table carefully, in which some values are missing (shown as ?), and answer the question given below.
Number of members in five clubs: total, female, male, ratio of female to male and percentage female
What percentage of the members in club S are female members?
Number of members in five clubs: total, female, male, ratio of female to male and percentage female
| Club | Total | Female | Male | Female : Male | Female (%) |
| P | 980 | ? | ? | ? | 45 |
| Q | ? | ? | 108 | ? | 70 |
| R | 900 | ? | 180 | ? | ? |
| S | ? | ? | 88 | 4 : 1 | ? |
| T | ? | 162 | ? | ? | 30 |
What percentage of the members in club S are female members?
- 80%
- 90%
- 100%
- 110%
- 120%
General
✓✗Directions: Study the following table carefully, in which some values are missing (shown as ?), and answer the question given below.
Number of members in five clubs: total, female, male, ratio of female to male and percentage female
What is the ratio of the number of female members in club Q to the number of female members in club R?
Number of members in five clubs: total, female, male, ratio of female to male and percentage female
| Club | Total | Female | Male | Female : Male | Female (%) |
| P | 980 | ? | ? | ? | 45 |
| Q | ? | ? | 108 | ? | 70 |
| R | 900 | ? | 180 | ? | ? |
| S | ? | ? | 88 | 4 : 1 | ? |
| T | ? | 162 | ? | ? | 30 |
What is the ratio of the number of female members in club Q to the number of female members in club R?
- 7 : 22
- 4 : 11
- 20 : 7
- 7 : 20
- 5 : 11
General
✓✗Directions: Study the following table carefully, in which some values are missing (shown as ?), and answer the question given below.
Number of members in five clubs: total, female, male, ratio of female to male and percentage female
What is the total number of male members in all the five clubs together?
Number of members in five clubs: total, female, male, ratio of female to male and percentage female
| Club | Total | Female | Male | Female : Male | Female (%) |
| P | 980 | ? | ? | ? | 45 |
| Q | ? | ? | 108 | ? | 70 |
| R | 900 | ? | 180 | ? | ? |
| S | ? | ? | 88 | 4 : 1 | ? |
| T | ? | 162 | ? | ? | 30 |
What is the total number of male members in all the five clubs together?
- 1268
- 1293
- 1318
- 1343
- 1368
General
✓✗Directions: Study the following graph and table carefully and answer the question given below.
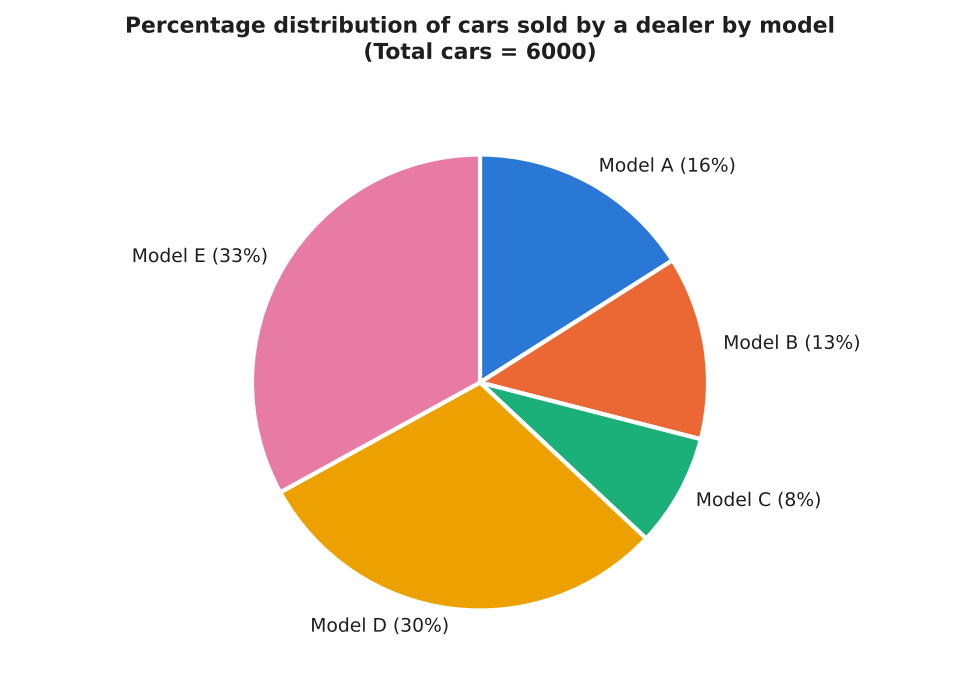
Ratio of petrol cars to diesel cars, and percentage of diesel cars that were bought on loan, in each model
What is the total number of diesel cars that were bought on loan across all the five models together?
Ratio of petrol cars to diesel cars, and percentage of diesel cars that were bought on loan, in each model
| Model | Petrol : Diesel | Diesel cars that were bought on loan (%) |
| Model A | 3 : 7 | 50 |
| Model B | 1 : 1 | 20 |
| Model C | 7 : 5 | 60 |
| Model D | 5 : 7 | 20 |
| Model E | 3 : 2 | 25 |
What is the total number of diesel cars that were bought on loan across all the five models together?
- 892
- 917
- 942
- 967
- 992
General
✓✗Directions: Study the following graph and table carefully and answer the question given below.
Ratio of petrol cars to diesel cars, and percentage of diesel cars that were bought on loan, in each model
The number of petrol cars for Model A is what percent more than the number of diesel cars for Model C?
Ratio of petrol cars to diesel cars, and percentage of diesel cars that were bought on loan, in each model
| Model | Petrol : Diesel | Diesel cars that were bought on loan (%) |
| Model A | 3 : 7 | 50 |
| Model B | 1 : 1 | 20 |
| Model C | 7 : 5 | 60 |
| Model D | 5 : 7 | 20 |
| Model E | 3 : 2 | 25 |
The number of petrol cars for Model A is what percent more than the number of diesel cars for Model C?
- 41%
- 42%
- 43%
- 44%
- 45%
General
✓✗Directions: Study the following graph and table carefully and answer the question given below.
Ratio of petrol cars to diesel cars, and percentage of diesel cars that were bought on loan, in each model
What is the ratio of the number of petrol cars for Model A to the number of diesel cars that were bought on loan for Model E?
Ratio of petrol cars to diesel cars, and percentage of diesel cars that were bought on loan, in each model
| Model | Petrol : Diesel | Diesel cars that were bought on loan (%) |
| Model A | 3 : 7 | 50 |
| Model B | 1 : 1 | 20 |
| Model C | 7 : 5 | 60 |
| Model D | 5 : 7 | 20 |
| Model E | 3 : 2 | 25 |
What is the ratio of the number of petrol cars for Model A to the number of diesel cars that were bought on loan for Model E?
- 16 : 11
- 5 : 4
- 17 : 13
- 17 : 12
- 11 : 16
General
✓✗Directions: Study the following graph and table carefully and answer the question given below.
Ratio of petrol cars to diesel cars, and percentage of diesel cars that were bought on loan, in each model
What is the average number of petrol cars for Model B, Model D and Model E?
Ratio of petrol cars to diesel cars, and percentage of diesel cars that were bought on loan, in each model
| Model | Petrol : Diesel | Diesel cars that were bought on loan (%) |
| Model A | 3 : 7 | 50 |
| Model B | 1 : 1 | 20 |
| Model C | 7 : 5 | 60 |
| Model D | 5 : 7 | 20 |
| Model E | 3 : 2 | 25 |
What is the average number of petrol cars for Model B, Model D and Model E?
- 726
- 751
- 776
- 801
- 826
General
✓✗Directions: Study the following graph and table carefully and answer the question given below.
Ratio of petrol cars to diesel cars, and percentage of diesel cars that were bought on loan, in each model
The number of diesel cars that were bought on loan for Model C is what percent of the total number of cars for Model C?
Ratio of petrol cars to diesel cars, and percentage of diesel cars that were bought on loan, in each model
| Model | Petrol : Diesel | Diesel cars that were bought on loan (%) |
| Model A | 3 : 7 | 50 |
| Model B | 1 : 1 | 20 |
| Model C | 7 : 5 | 60 |
| Model D | 5 : 7 | 20 |
| Model E | 3 : 2 | 25 |
The number of diesel cars that were bought on loan for Model C is what percent of the total number of cars for Model C?
- 20%
- 25%
- 30%
- 35%
- 60%