General
✓✗Directions: Study the following table carefully, in which some values are missing (shown as ?), and answer the question given below.
Number of students who opted for three languages in five schools
What is the average number of students who opted for Hindi per school?
Number of students who opted for three languages in five schools
| School | Hindi | Sanskrit | French | Total |
| V | ? | 210 | 165 | 455 |
| W | 220 | ? | 135 | 495 |
| X | 140 | 60 | 110 | ? |
| Y | 85 | ? | 110 | 340 |
| Z | ? | 110 | 185 | 520 |
What is the average number of students who opted for Hindi per school?
- 110
- 120
- 130
- 140
- 150
General
✓✗Directions: Study the following table carefully, in which some values are missing (shown as ?), and answer the question given below.
Number of students who opted for three languages in five schools
What is the value of the Total for school X?
Number of students who opted for three languages in five schools
| School | Hindi | Sanskrit | French | Total |
| V | ? | 210 | 165 | 455 |
| W | 220 | ? | 135 | 495 |
| X | 140 | 60 | 110 | ? |
| Y | 85 | ? | 110 | 340 |
| Z | ? | 110 | 185 | 520 |
What is the value of the Total for school X?
- 310
- 330
- 350
- 370
- 390
General
✓✗Directions: Study the following table carefully and answer the question given below.
Length and speed of five trains
How much time (in seconds) will train Y take to cross a pole?
Length and speed of five trains
| Train | Length (in metres) | Speed (in km/h) |
| V | 180 | 54 |
| W | 100 | 90 |
| X | 100 | 54 |
| Y | 260 | 72 |
| Z | 340 | 126 |
How much time (in seconds) will train Y take to cross a pole?
- 11
- 13
- 15
- 17
- 19
General
✓✗Directions: Study the following table carefully and answer the question given below.
Length and speed of five trains
How much time (in seconds) will train W take to cross a platform 180 m long?
Length and speed of five trains
| Train | Length (in metres) | Speed (in km/h) |
| V | 180 | 54 |
| W | 100 | 90 |
| X | 100 | 54 |
| Y | 260 | 72 |
| Z | 340 | 126 |
How much time (in seconds) will train W take to cross a platform 180 m long?
- 7.2
- 9.2
- 10.2
- 11.2
- 12.2
General
✓✗Directions: Read the following information carefully and answer the question given below.
Five shops P, Q, R, S and T sell pens. Shop P sold 400 pens. Shop Q sold 30% more pens than shop P. Shop R sold 10% fewer pens than shop Q. Shop S sold 50% fewer pens than shop P. Shop T sold 25% fewer pens than shop P.
What is the average number of pens sold by the five shops?
Five shops P, Q, R, S and T sell pens. Shop P sold 400 pens. Shop Q sold 30% more pens than shop P. Shop R sold 10% fewer pens than shop Q. Shop S sold 50% fewer pens than shop P. Shop T sold 25% fewer pens than shop P.
What is the average number of pens sold by the five shops?
- 337.6
- 357.6
- 377.6
- 397.6
- 417.6
General
✓✗Directions: Read the following information carefully and answer the question given below.
Five shops P, Q, R, S and T sell pens. Shop P sold 400 pens. Shop Q sold 30% more pens than shop P. Shop R sold 10% fewer pens than shop Q. Shop S sold 50% fewer pens than shop P. Shop T sold 25% fewer pens than shop P.
What is the ratio of the number of pens sold by shop S to that sold by shop Q?
Five shops P, Q, R, S and T sell pens. Shop P sold 400 pens. Shop Q sold 30% more pens than shop P. Shop R sold 10% fewer pens than shop Q. Shop S sold 50% fewer pens than shop P. Shop T sold 25% fewer pens than shop P.
What is the ratio of the number of pens sold by shop S to that sold by shop Q?
- 5 : 13
- 5 : 12
- 5 : 14
- 13 : 5
- 2 : 7
General
✓✗Directions: Study the following bar graph carefully and answer the question given below.
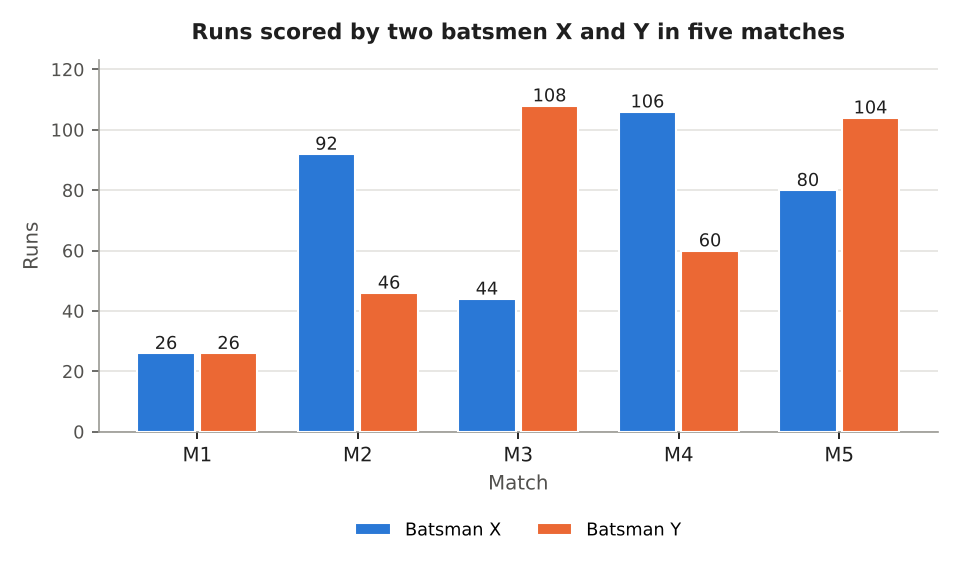
The runs scored by batsman Y in M1 are what percent of the runs scored by batsman X in M5?
The runs scored by batsman Y in M1 are what percent of the runs scored by batsman X in M5?
- 20.5%
- 23.5%
- 26.5%
- 29.5%
- 32.5%
General
✓✗Directions: Study the following bar graph carefully and answer the question given below.
What is the average runs scored by batsman Y in M2, M3 and M5?
What is the average runs scored by batsman Y in M2, M3 and M5?
- 66
- 71
- 76
- 81
- 86
General
✓✗Directions: Study the following bar graph carefully and answer the question given below.
What is the difference between the total runs scored by batsman X and the total runs scored by batsman Y in all the five matches?
What is the difference between the total runs scored by batsman X and the total runs scored by batsman Y in all the five matches?
- 4
- 5
- 6
- 7
- 8
General
✓✗Directions: Study the following pie chart carefully and answer the question given below.
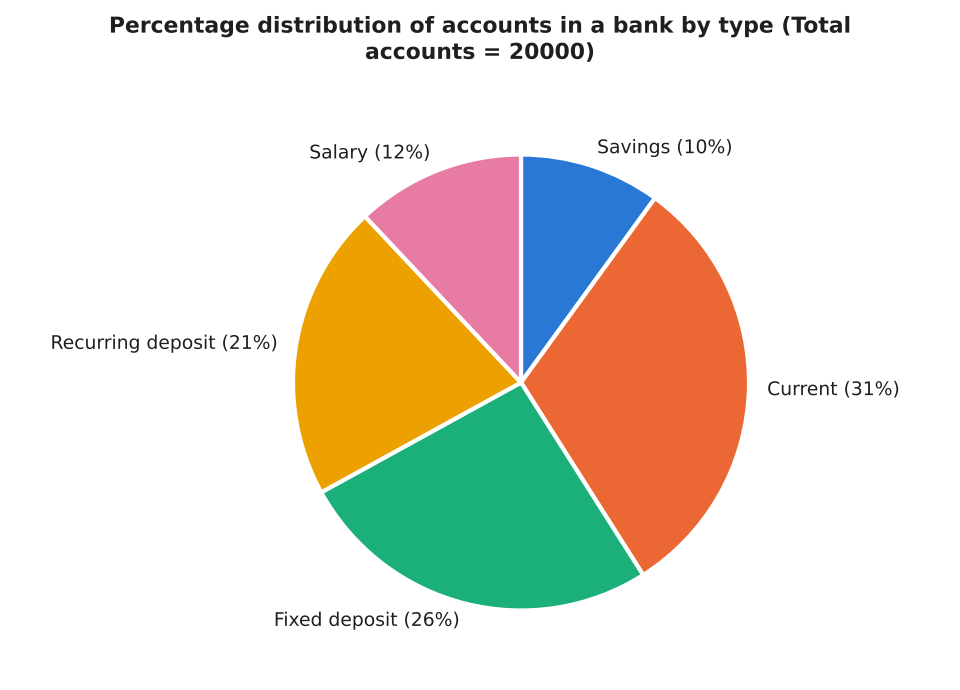
Which account type has the second largest share?
Which account type has the second largest share?
- Savings
- Current
- Fixed deposit
- Recurring deposit
- Salary
General
✓✗Directions: Study the following pie chart carefully and answer the question given below.
What is the central angle (in degrees) of the sector representing Current?
What is the central angle (in degrees) of the sector representing Current?
- 93
- 106.6
- 111.6
- 116.6
- 121.6
General
✓✗Directions: Study the following pie chart carefully and answer the question given below.
What is the average of the number of Savings, Fixed deposit and Salary accounts?
What is the average of the number of Savings, Fixed deposit and Salary accounts?
- 2600
- 2800
- 3000
- 3200
- 3400
General
✓✗Directions: Study the following line graph carefully and answer the question given below.
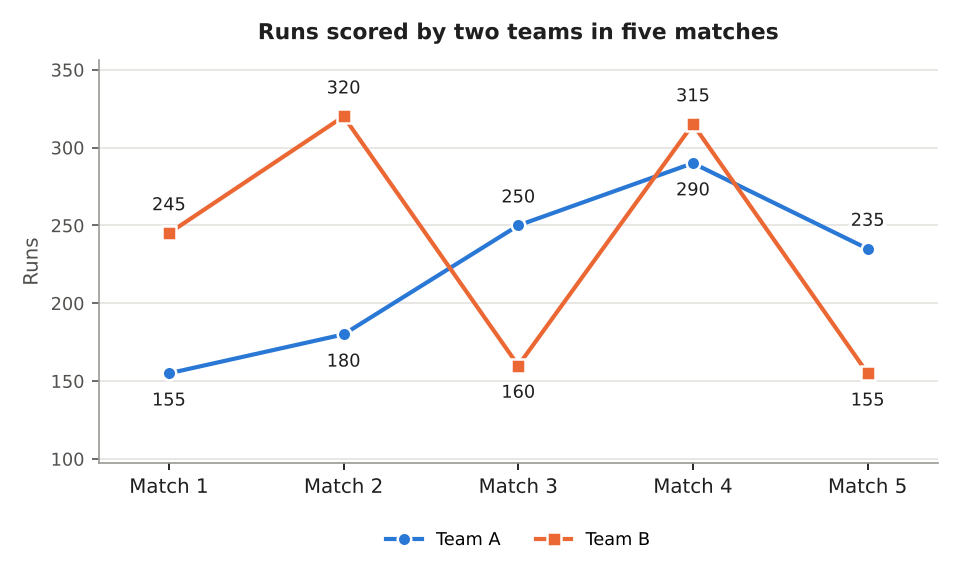
What is the sum of the runs scored by Team B in Match 1 and that in Match 5?
What is the sum of the runs scored by Team B in Match 1 and that in Match 5?
- 360
- 380
- 400
- 420
- 440
General
✓✗Directions: Study the following line graph carefully and answer the question given below.
What is the average runs scored by Team A in Match 1, Match 2 and Match 3?
What is the average runs scored by Team A in Match 1, Match 2 and Match 3?
- 185
- 195
- 205
- 215
- 225
General
✓✗Directions: Study the following line graph carefully and answer the question given below.
The runs scored by Team B in Match 4 are what percent of the runs scored by Team A in Match 3?
The runs scored by Team B in Match 4 are what percent of the runs scored by Team A in Match 3?
- 106%
- 116%
- 126%
- 136%
- 146%
General
✓✗Directions: Study the following table carefully and answer the question given below.
Marks obtained by five students in four subjects
What percentage of marks did Naina obtain in Science?
Marks obtained by five students in four subjects
| Student | English (out of 100) | Mathematics (out of 150) | Science (out of 150) | Social Science (out of 100) |
| Lata | 44 | 104 | 133 | 45 |
| Mohit | 68 | 92 | 106 | 74 |
| Naina | 64 | 146 | 129 | 58 |
| Om | 88 | 84 | 56 | 67 |
| Priya | 93 | 89 | 104 | 68 |
What percentage of marks did Naina obtain in Science?
- 86%
- 91%
- 96%
- 101%
- 106%
General
✓✗Directions: Study the following table carefully and answer the question given below.
Marks obtained by five students in four subjects
What is the overall percentage of marks obtained by Priya in all four subjects together?
Marks obtained by five students in four subjects
| Student | English (out of 100) | Mathematics (out of 150) | Science (out of 150) | Social Science (out of 100) |
| Lata | 44 | 104 | 133 | 45 |
| Mohit | 68 | 92 | 106 | 74 |
| Naina | 64 | 146 | 129 | 58 |
| Om | 88 | 84 | 56 | 67 |
| Priya | 93 | 89 | 104 | 68 |
What is the overall percentage of marks obtained by Priya in all four subjects together?
- 65.8%
- 70.8%
- 75.8%
- 80.8%
- 88.5%
General
✓✗Directions: Study the following table carefully and answer the question given below.
Marks obtained by five students in four subjects
How many students obtained more than 70% marks in Science?
Marks obtained by five students in four subjects
| Student | English (out of 100) | Mathematics (out of 150) | Science (out of 150) | Social Science (out of 100) |
| Lata | 44 | 104 | 133 | 45 |
| Mohit | 68 | 92 | 106 | 74 |
| Naina | 64 | 146 | 129 | 58 |
| Om | 88 | 84 | 56 | 67 |
| Priya | 93 | 89 | 104 | 68 |
How many students obtained more than 70% marks in Science?
- 1
- 2
- 3
- 4
- 5
General
✓✗Directions: Study the following graph and table carefully and answer the question given below.
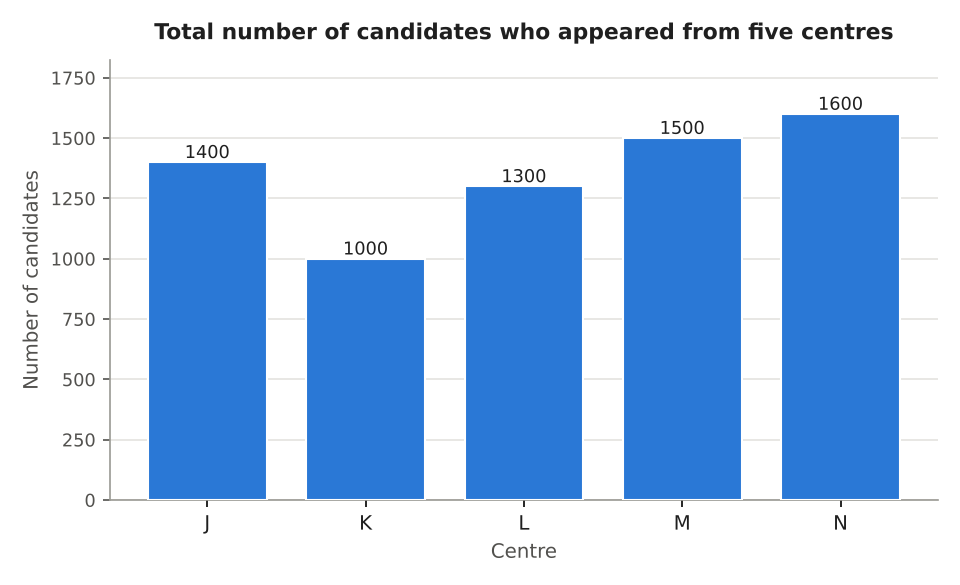
Percentage of candidates who passed out of the total candidates
What is the ratio of the number of candidates who passed from centre J to the number of candidates who failed from centre K?
Percentage of candidates who passed out of the total candidates
| Centre | Passed (%) |
| J | 40 |
| K | 80 |
| L | 45 |
| M | 80 |
| N | 65 |
What is the ratio of the number of candidates who passed from centre J to the number of candidates who failed from centre K?
- 16 : 5
- 5 : 14
- 13 : 6
- 7 : 2
- 14 : 5
General
✓✗Directions: Study the following graph and table carefully and answer the question given below.
Percentage of candidates who passed out of the total candidates
The number of candidates who passed from centre M is what percent more than that from centre K?
Percentage of candidates who passed out of the total candidates
| Centre | Passed (%) |
| J | 40 |
| K | 80 |
| L | 45 |
| M | 80 |
| N | 65 |
The number of candidates who passed from centre M is what percent more than that from centre K?
- 10%
- 20%
- 30%
- 40%
- 50%